Network
ApiTune provides a comprehensive network monitoring and manipulation interface, enabling detailed inspection and modification of HTTP/HTTPS traffic.
Traffic Filtering
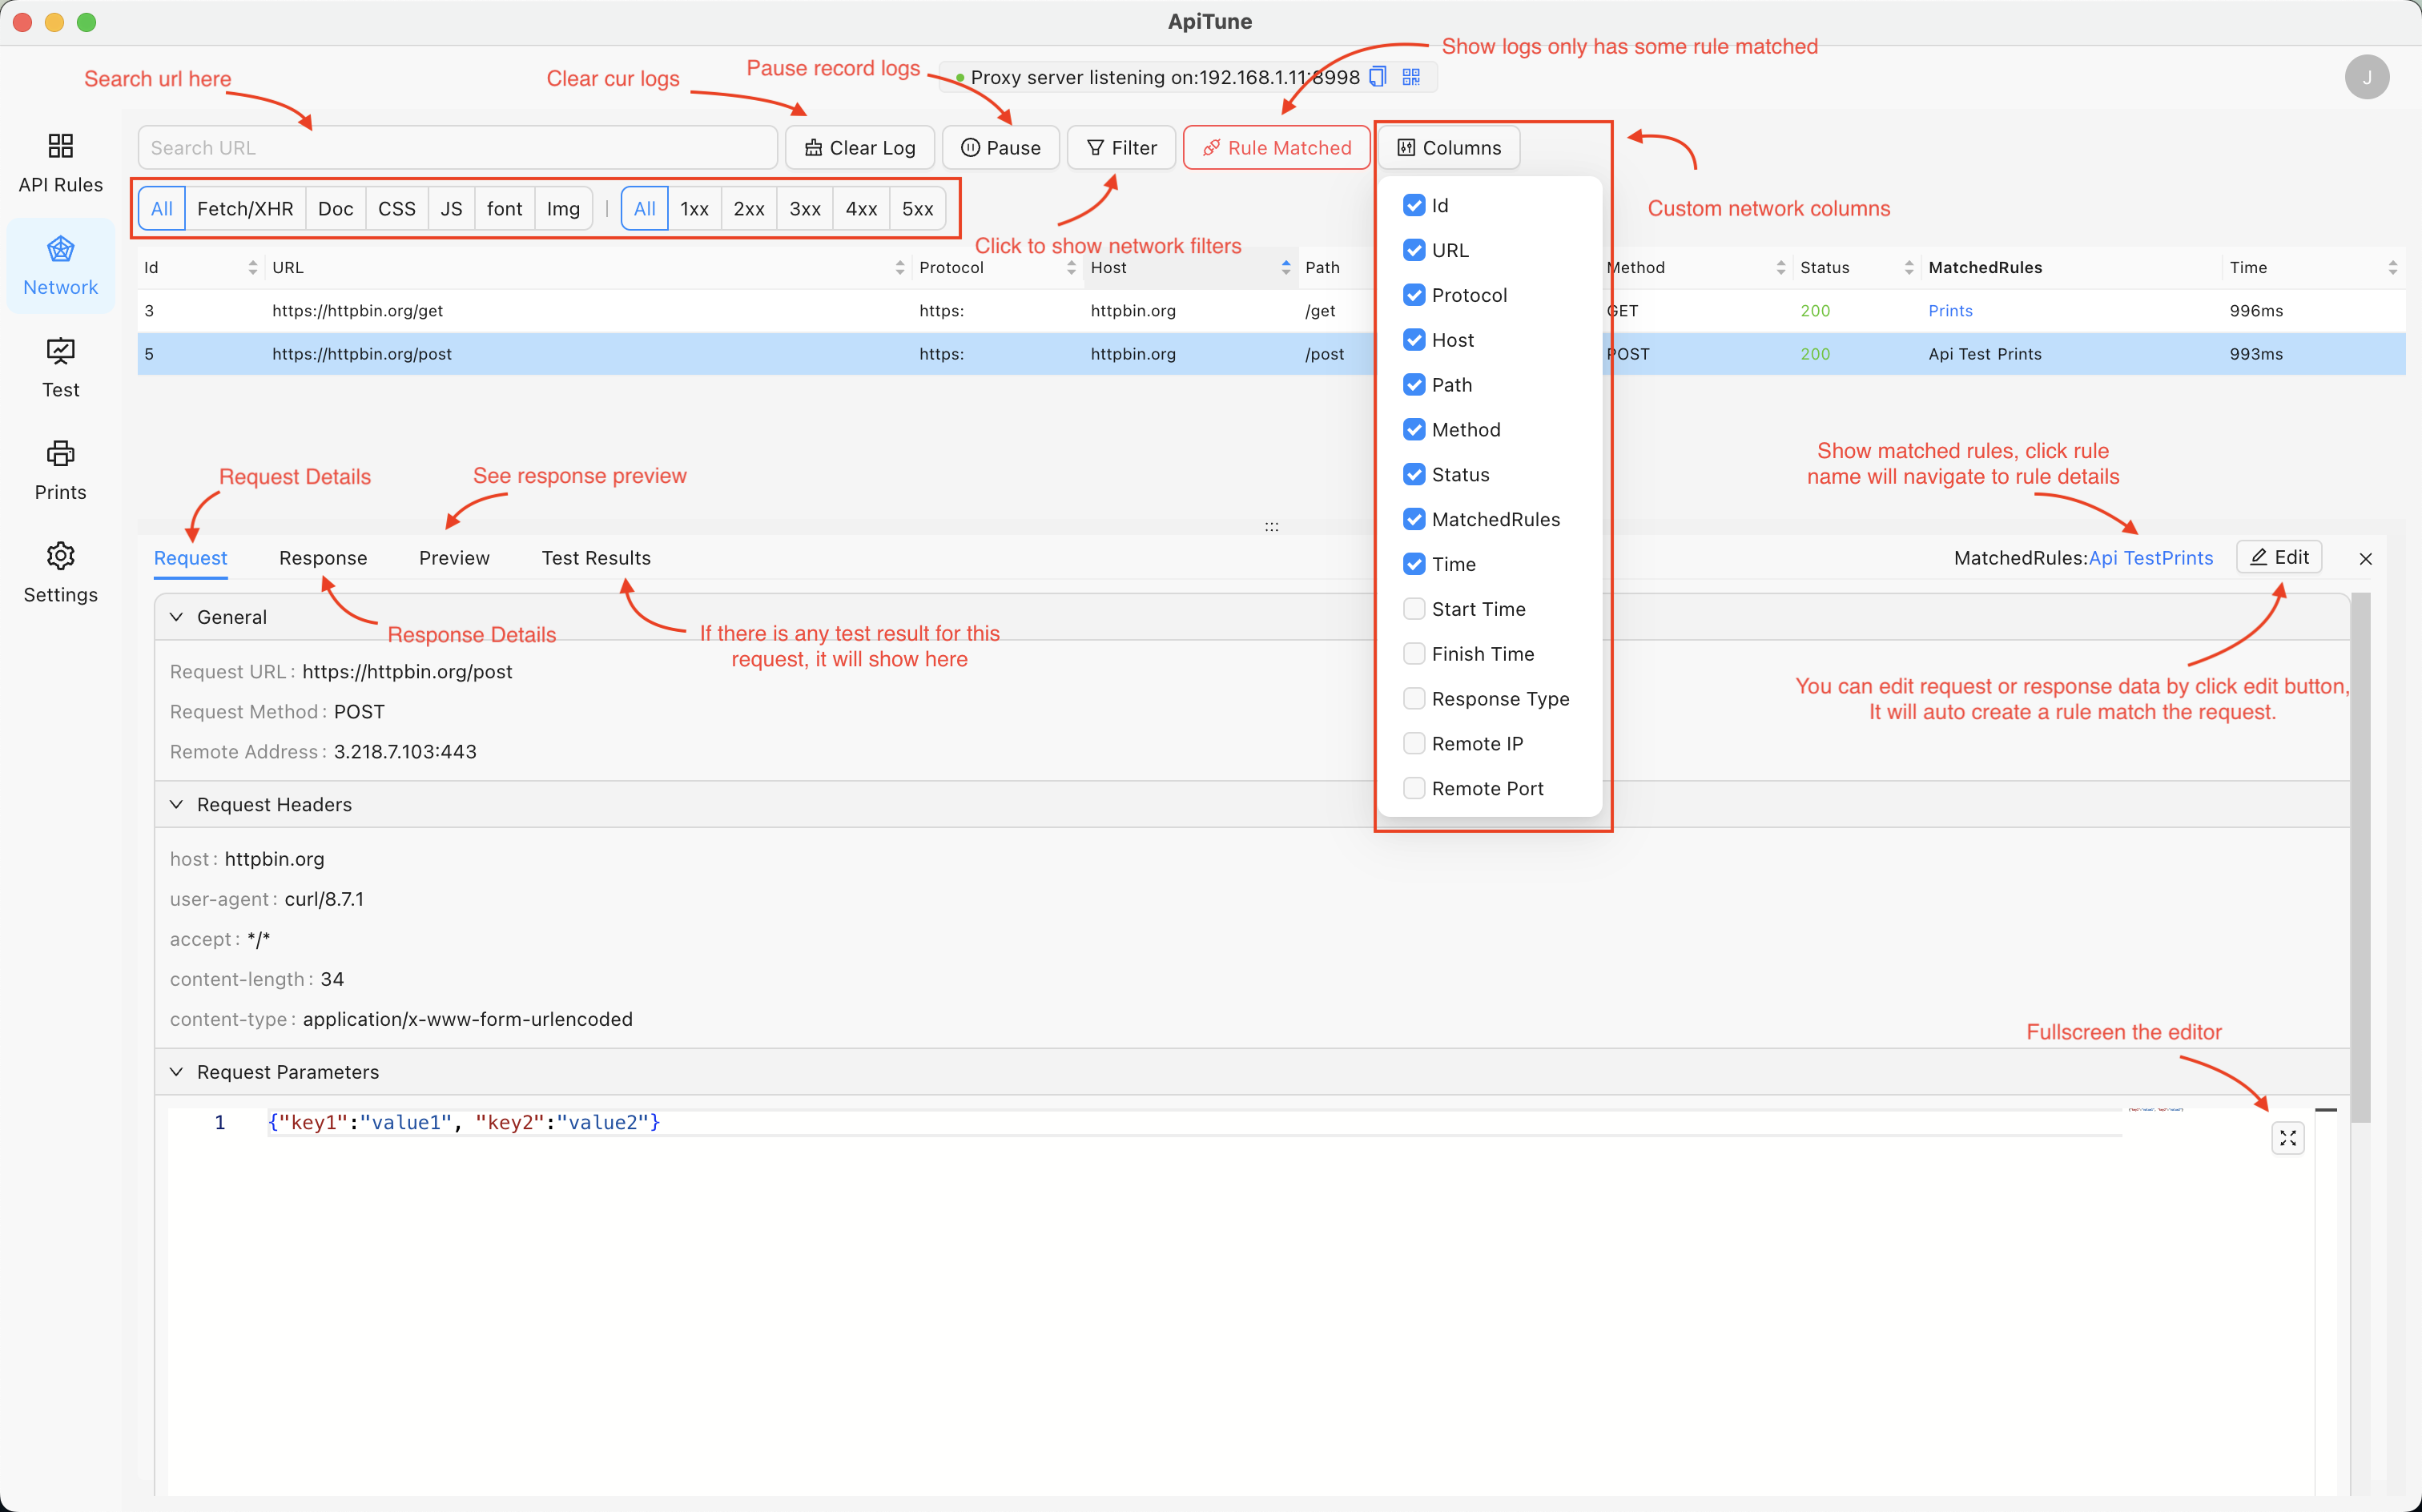
Access the advanced filtering system via the Filter button to precisely control visible network traffic.
Filter options include:
- Request types (XHR, Fetch, Document, etc.)
- Response status codes
- Custom filtering patterns

Column Customization
Customize the network panel layout through the Columns button to display relevant information for your debugging needs.
Data Organization
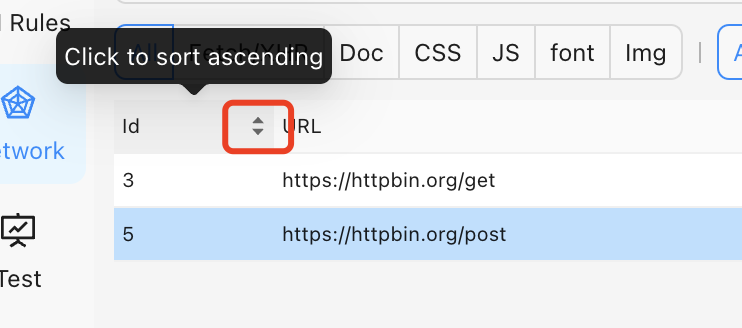
Sort network entries by clicking column headers to arrange data in ascending or descending order.
Request & Response Analysis
Select any network entry to access detailed request and response information through dedicated tabs:
Request Inspector
View comprehensive request details including headers, parameters, and payload data. 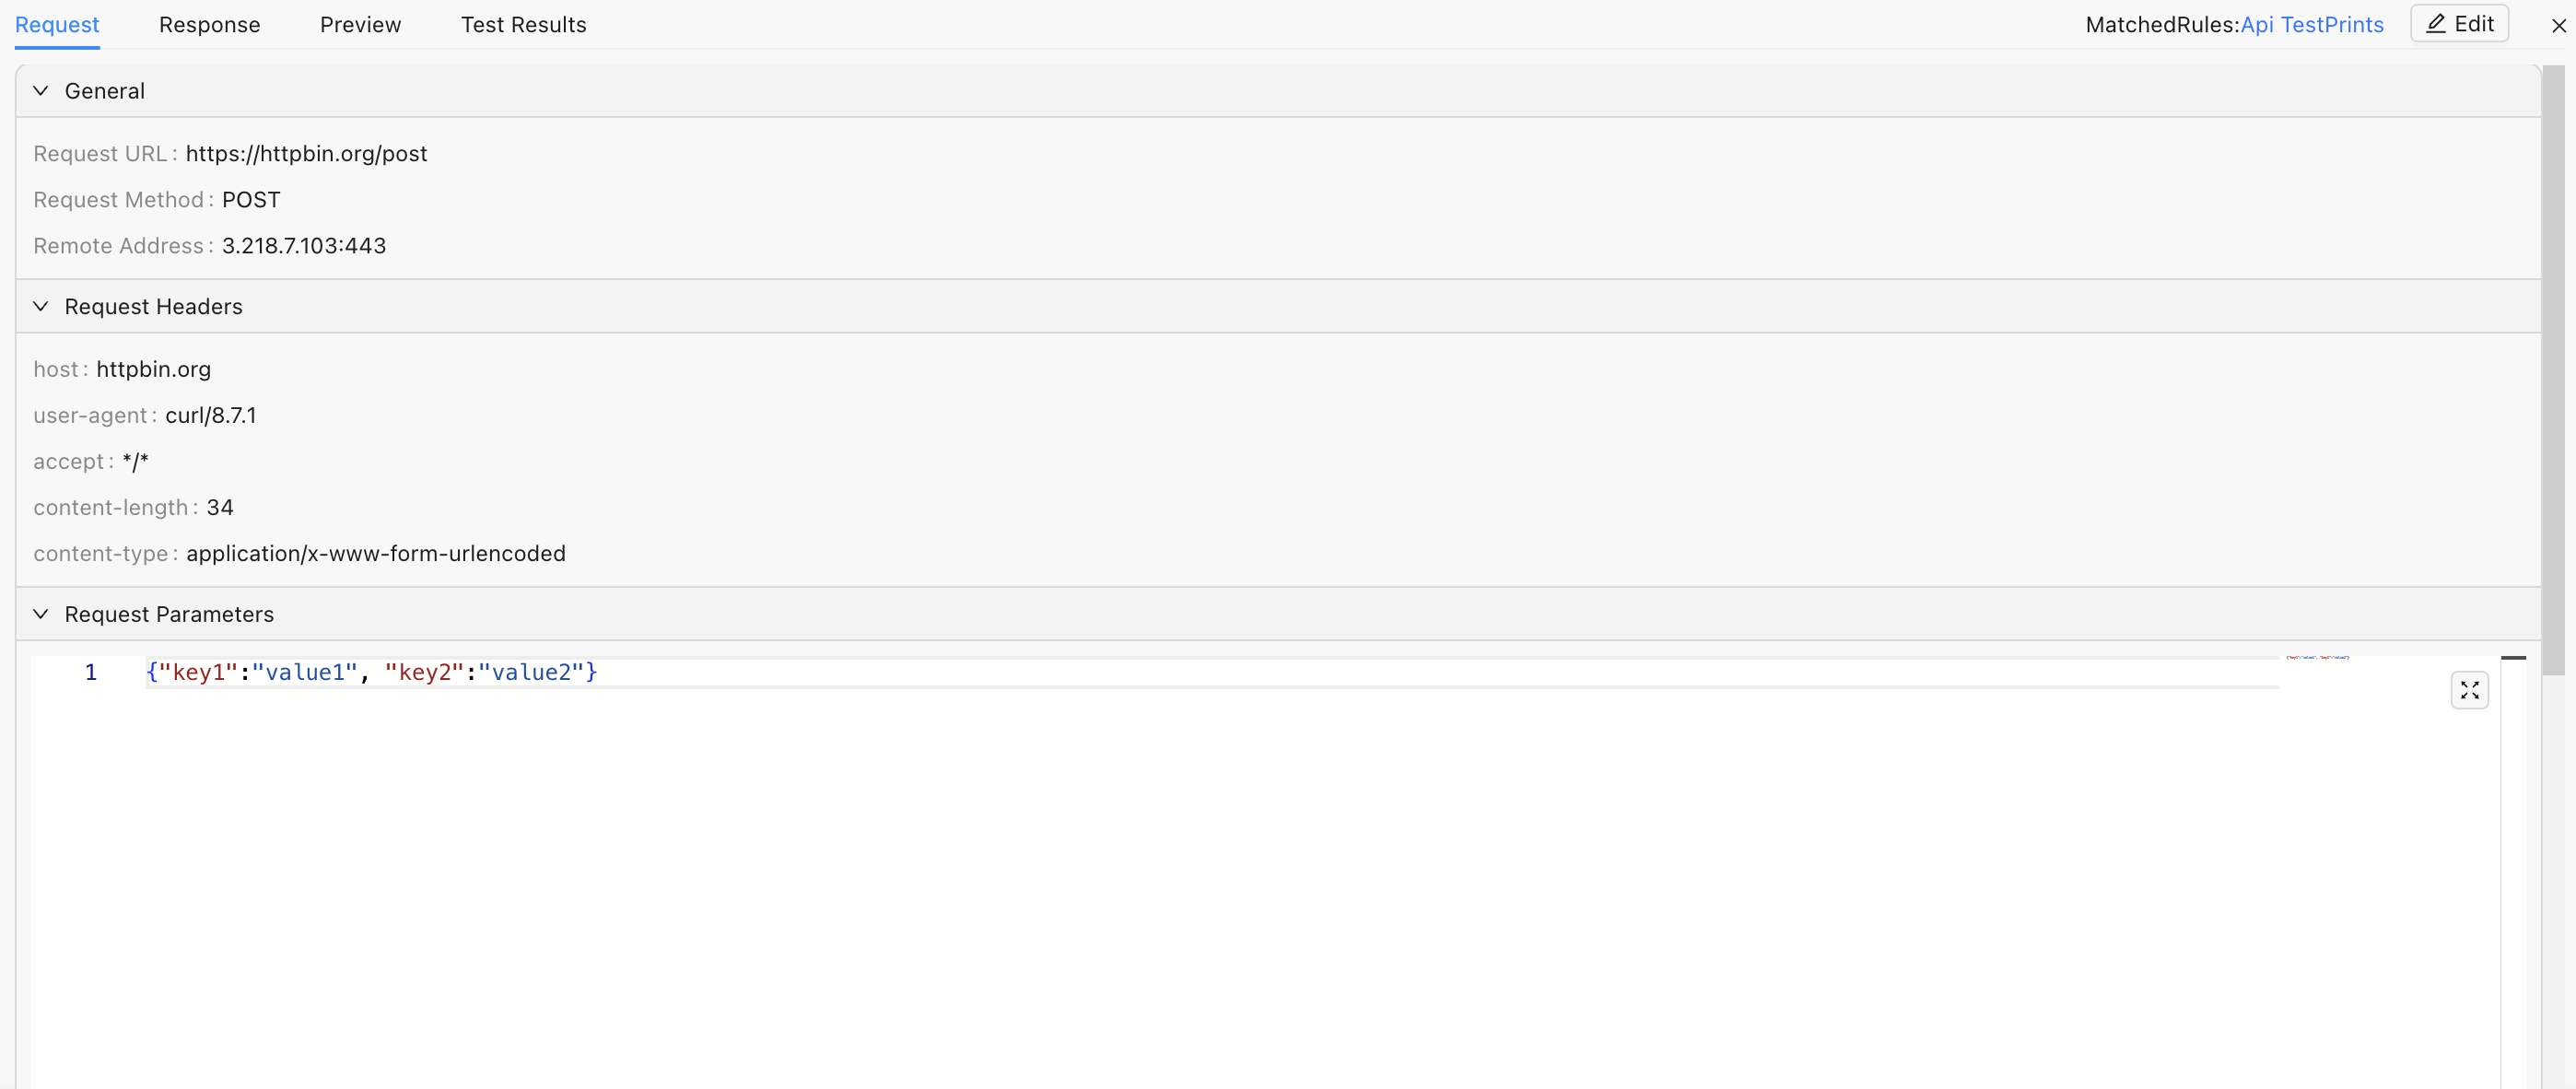
Response Inspector
Examine response headers, status codes, and body content. 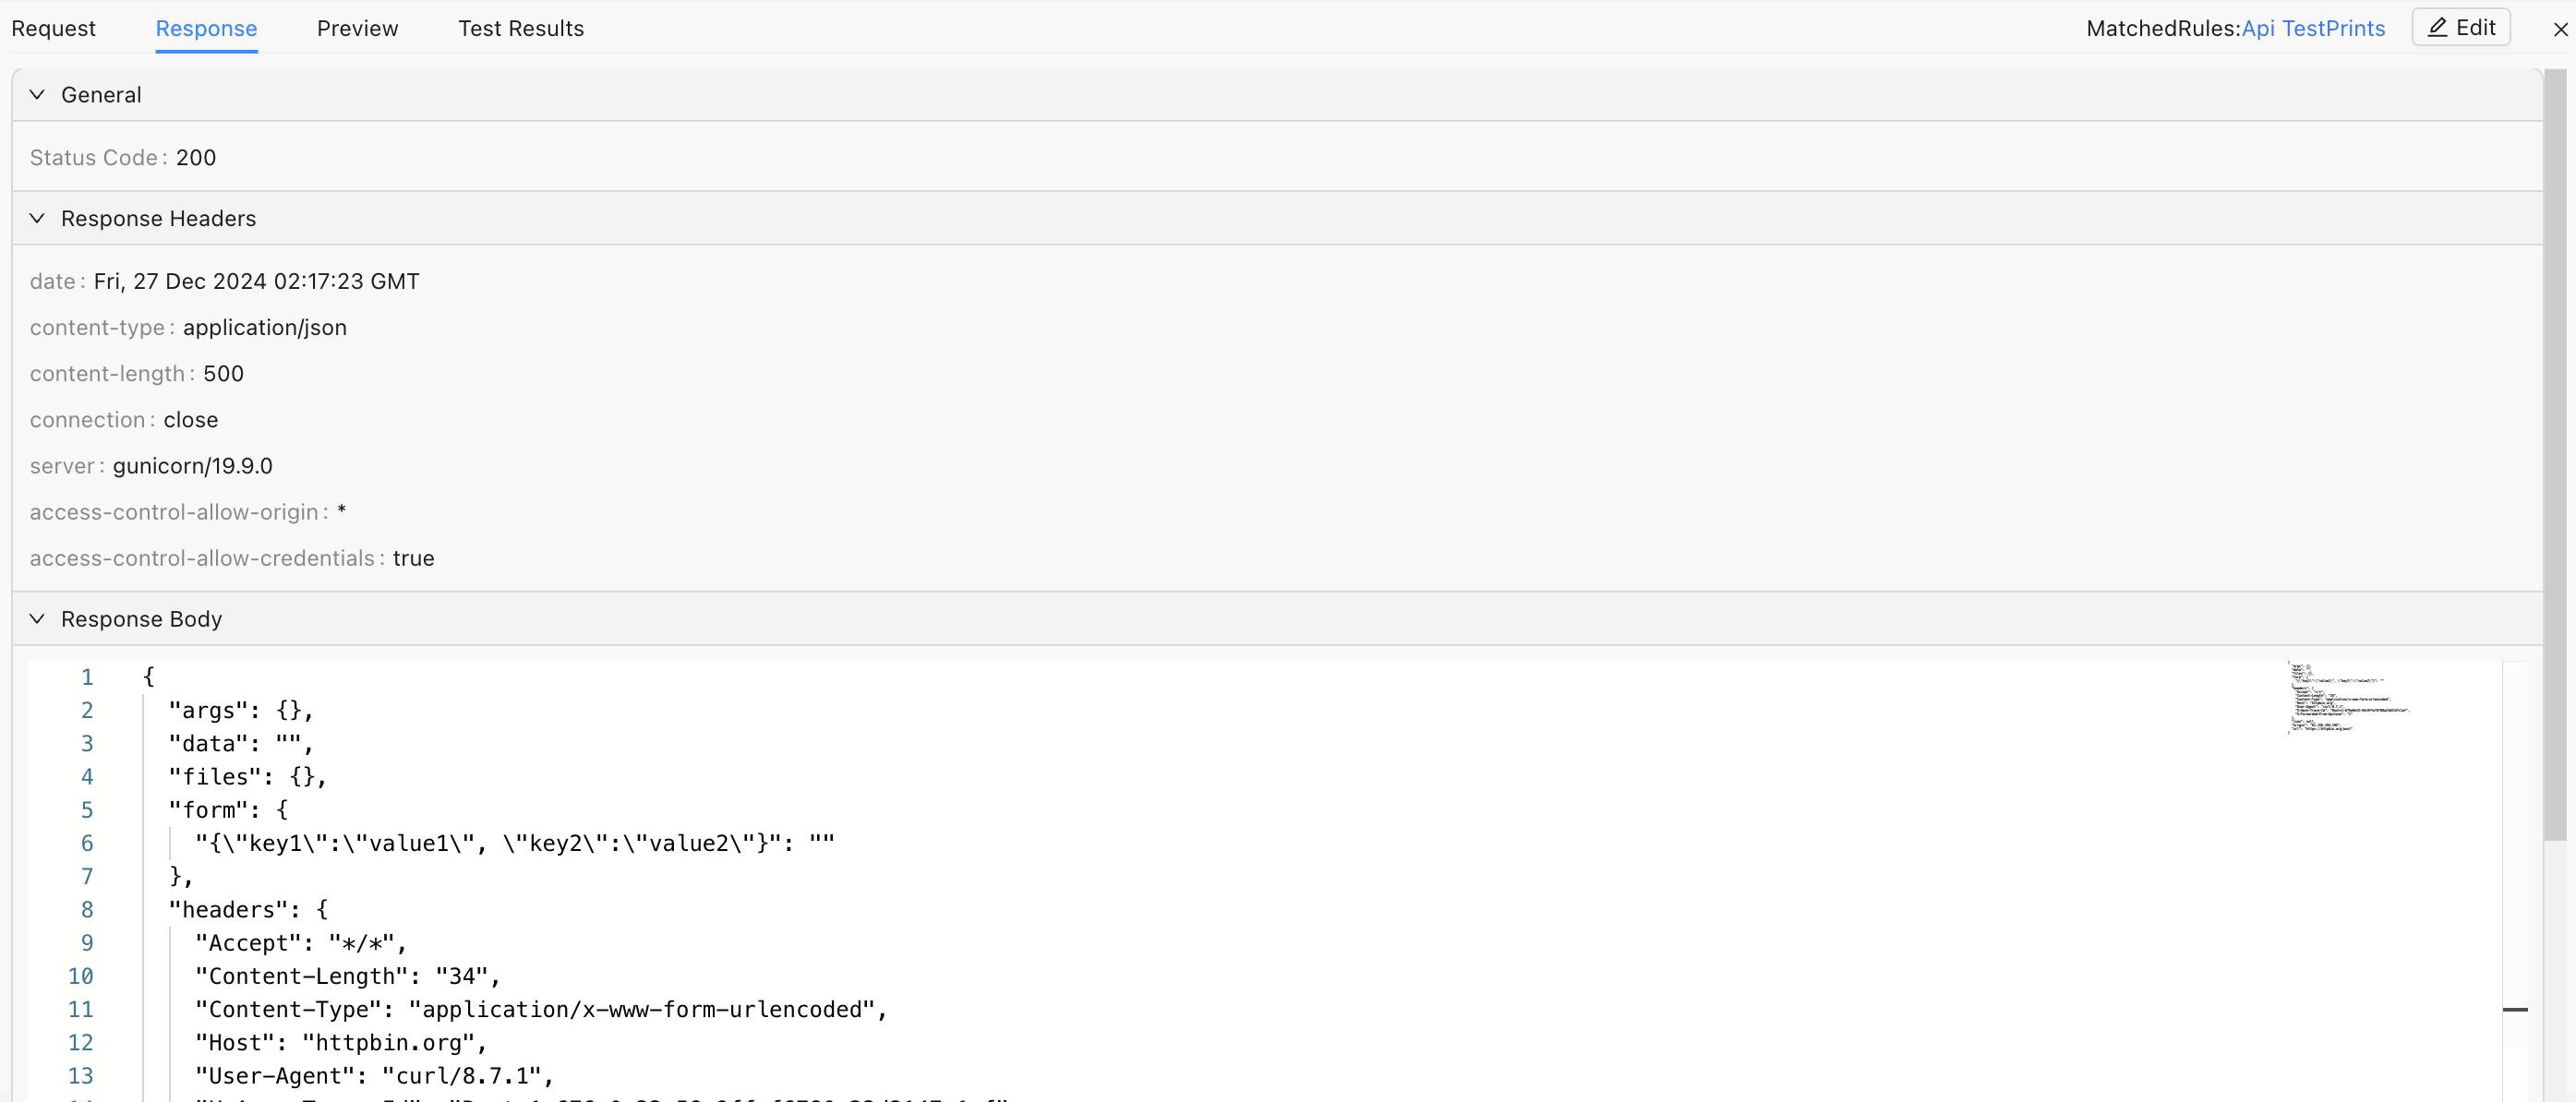
Response Preview
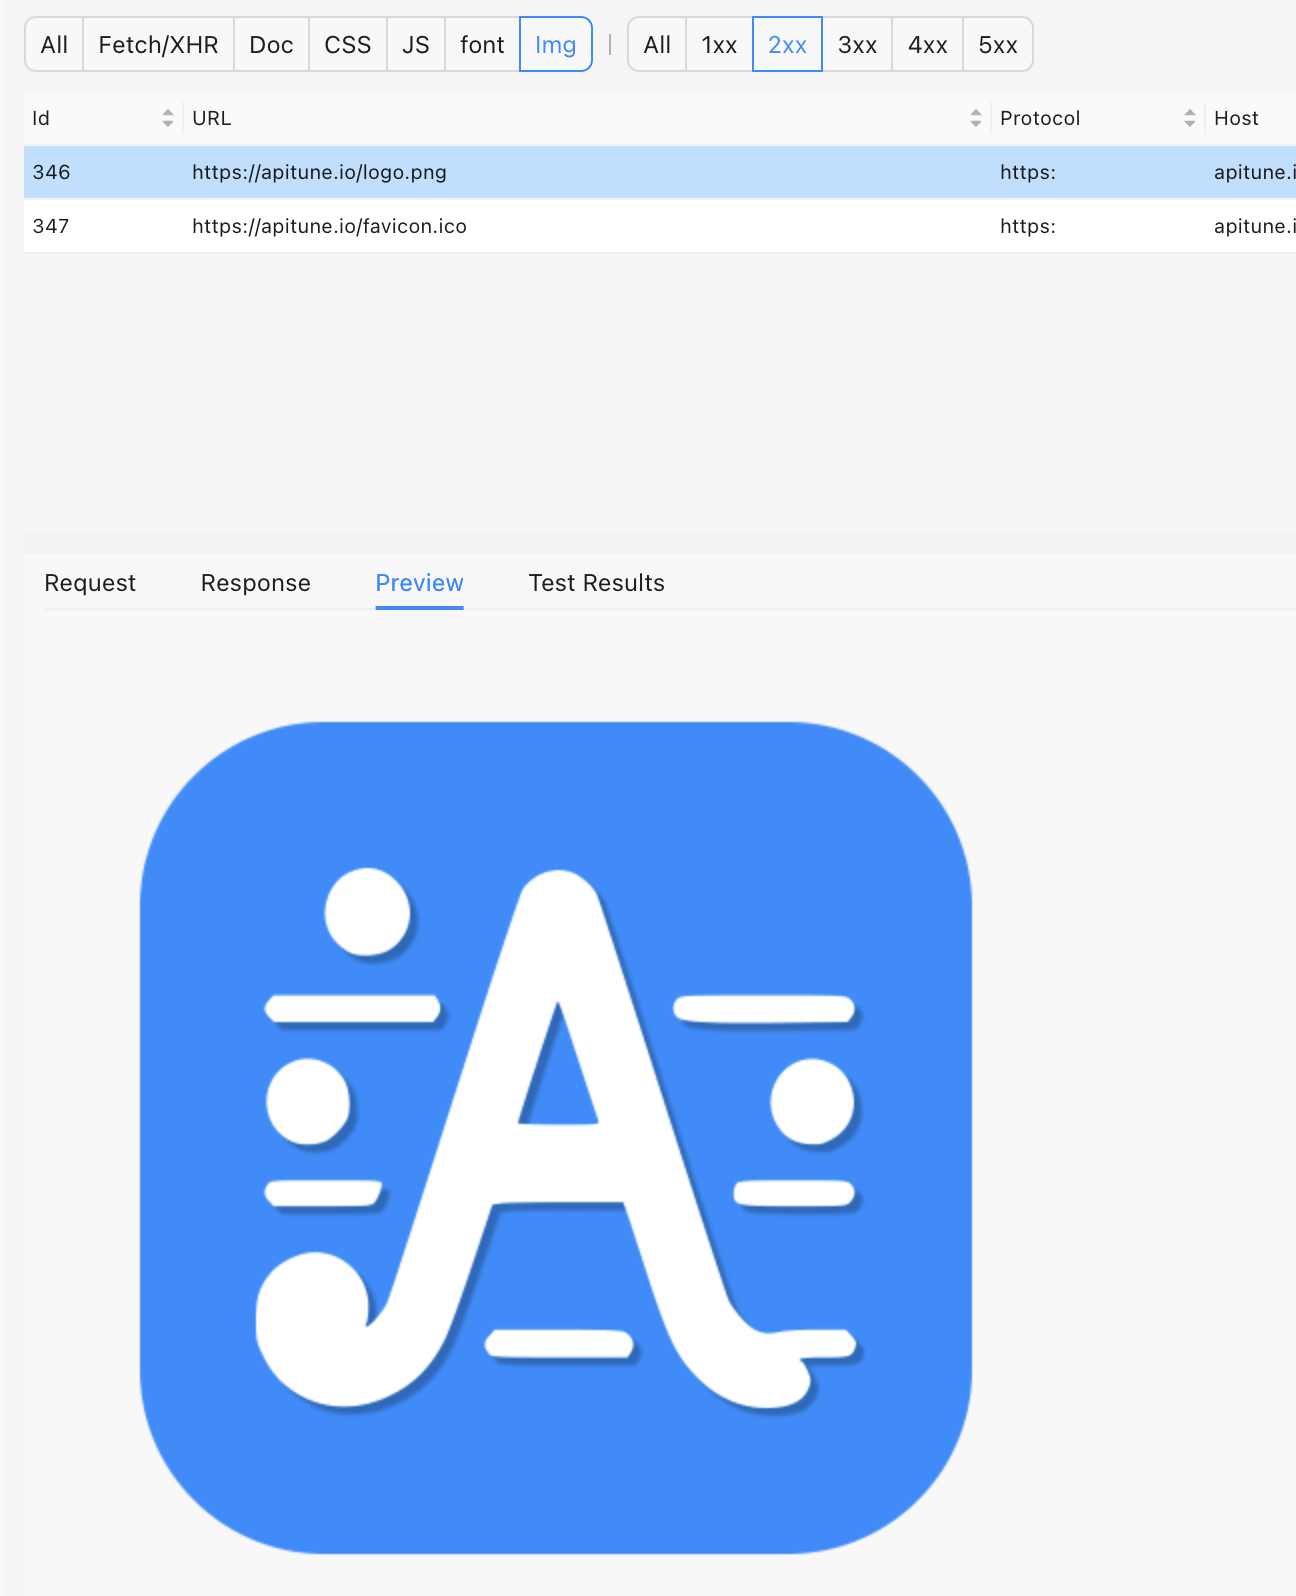
The Preview tab offers formatted visualization of response data:
- Automatic syntax highlighting for code
- Direct image rendering
- Structured data formatting

Test Results
For requests with associated test scripts, view execution results and assertions in the Test tab.

Request/Response Modification
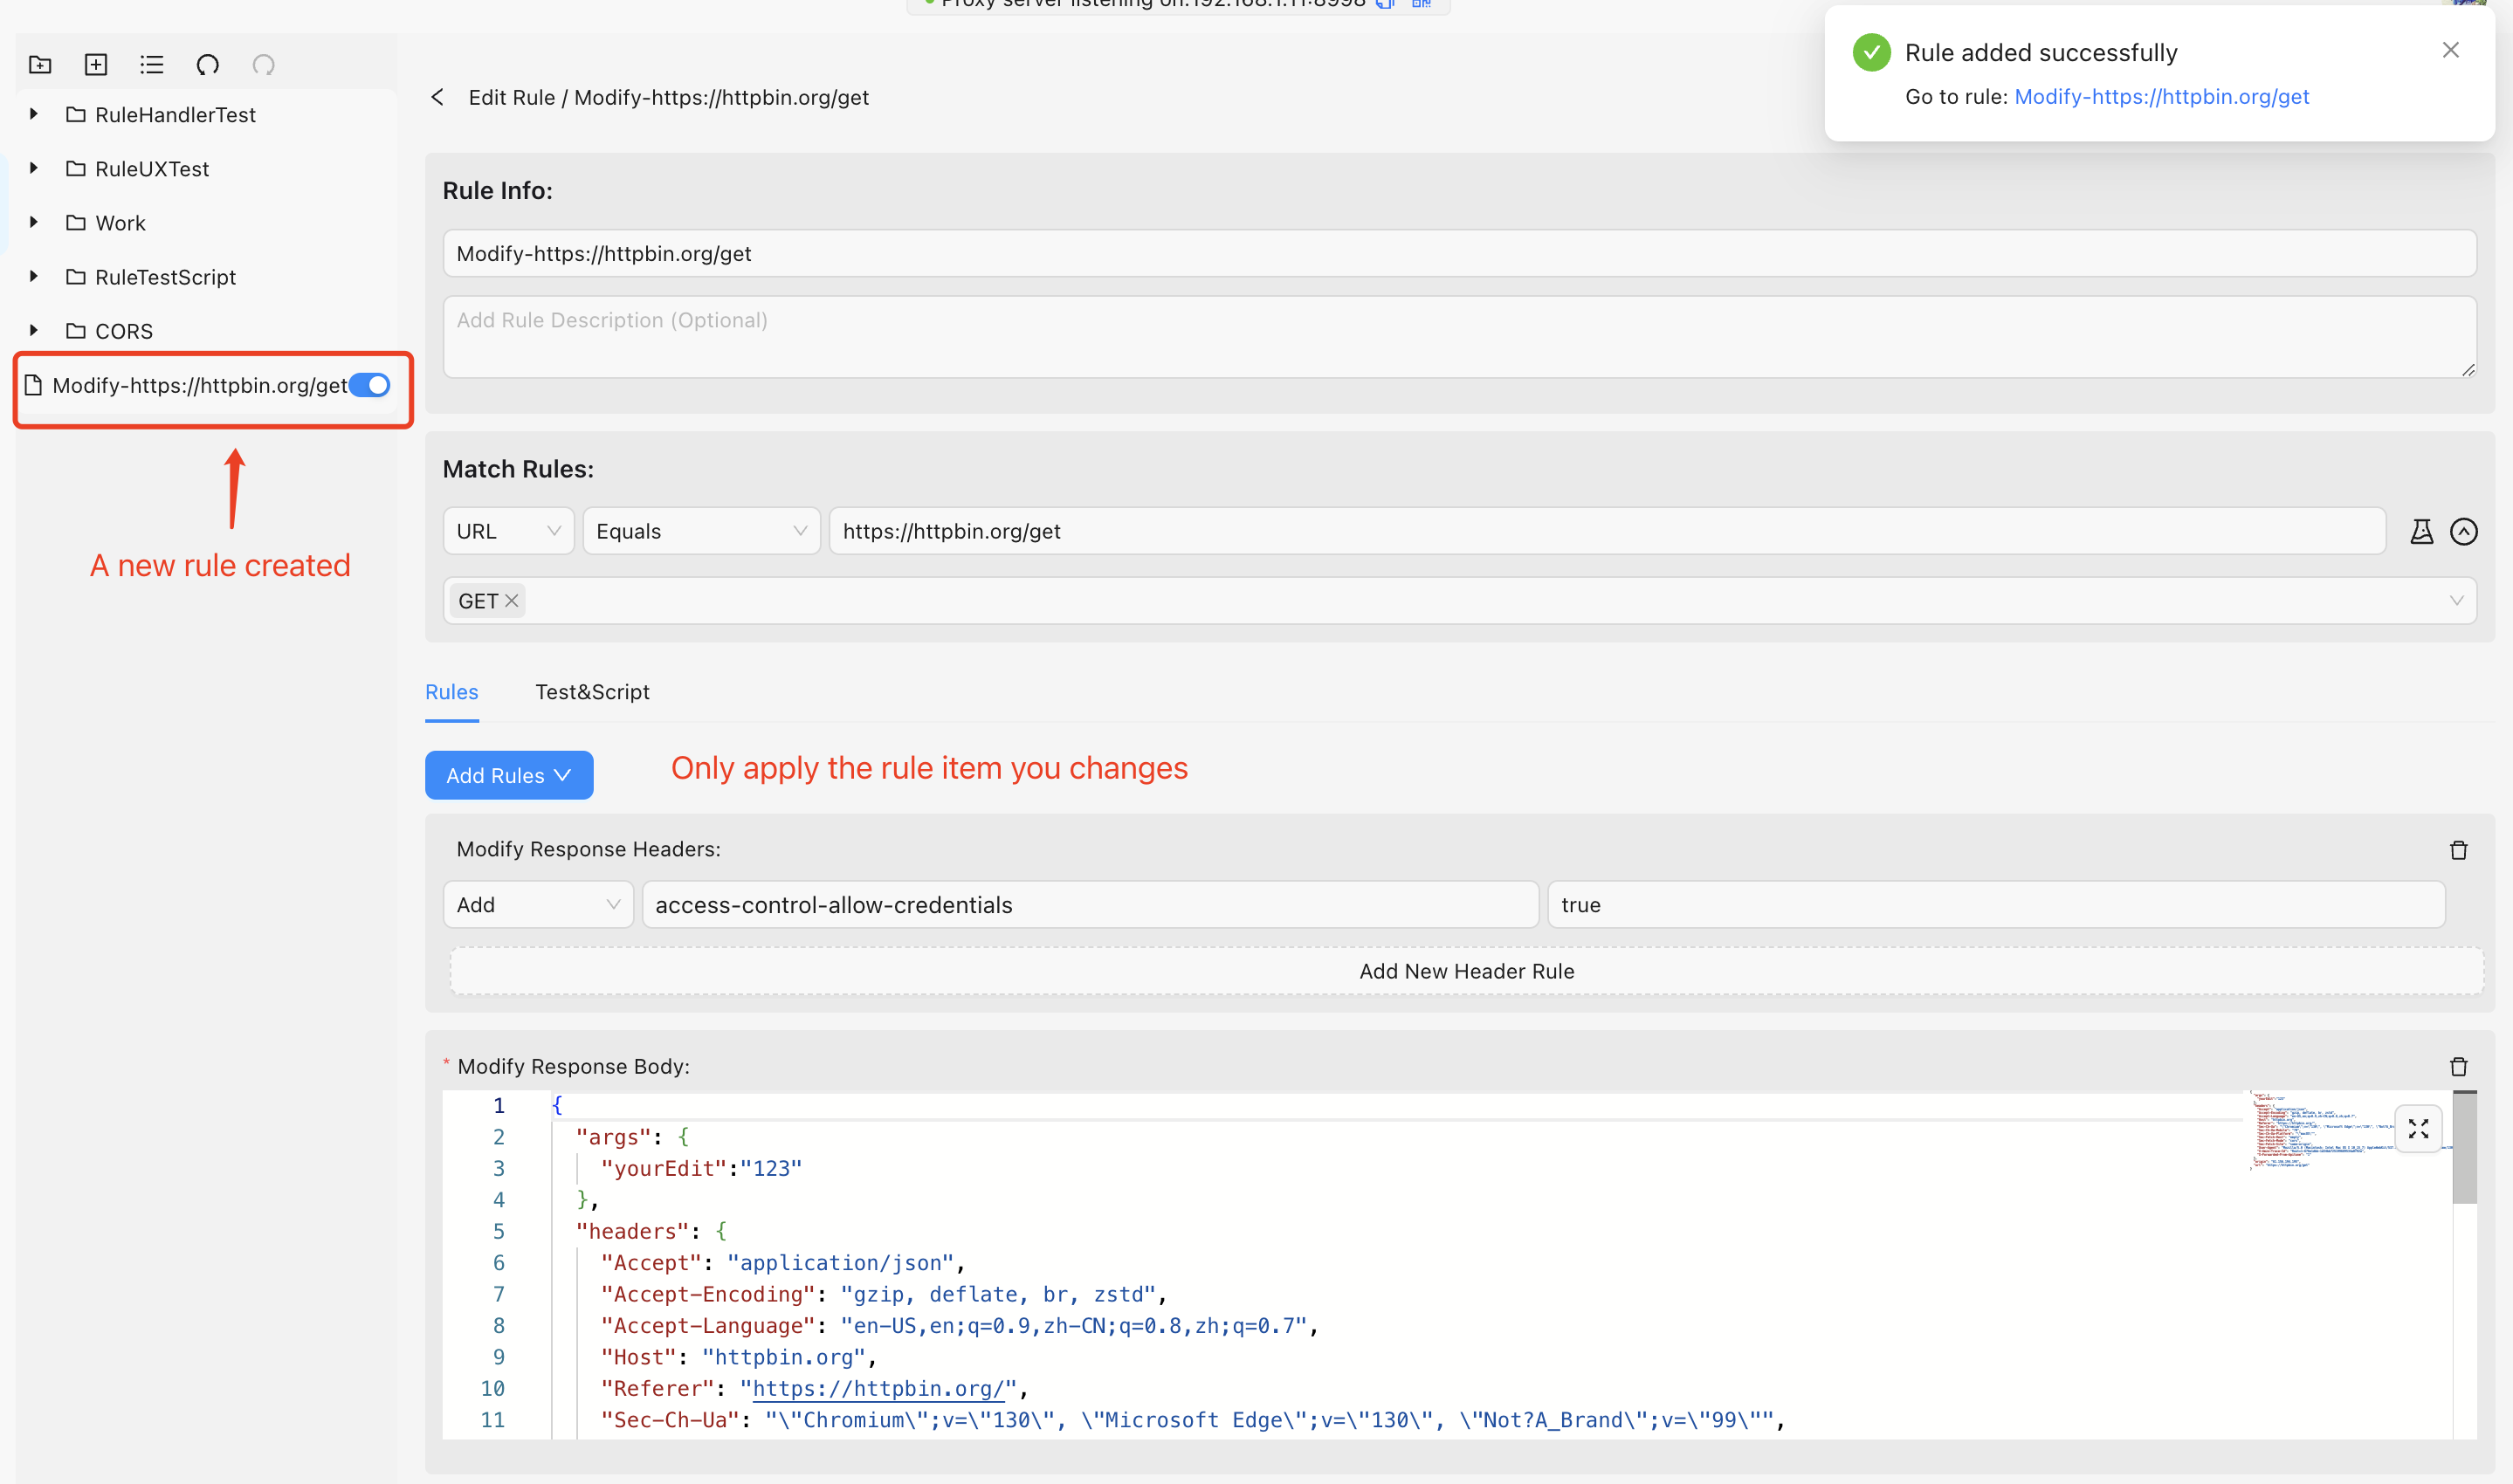
Enable real-time traffic modification through the Edit button:
- Activate edit mode to modify request/response properties
- ApiTune automatically generates corresponding modification rules
- Changes apply specifically to the selected request pattern
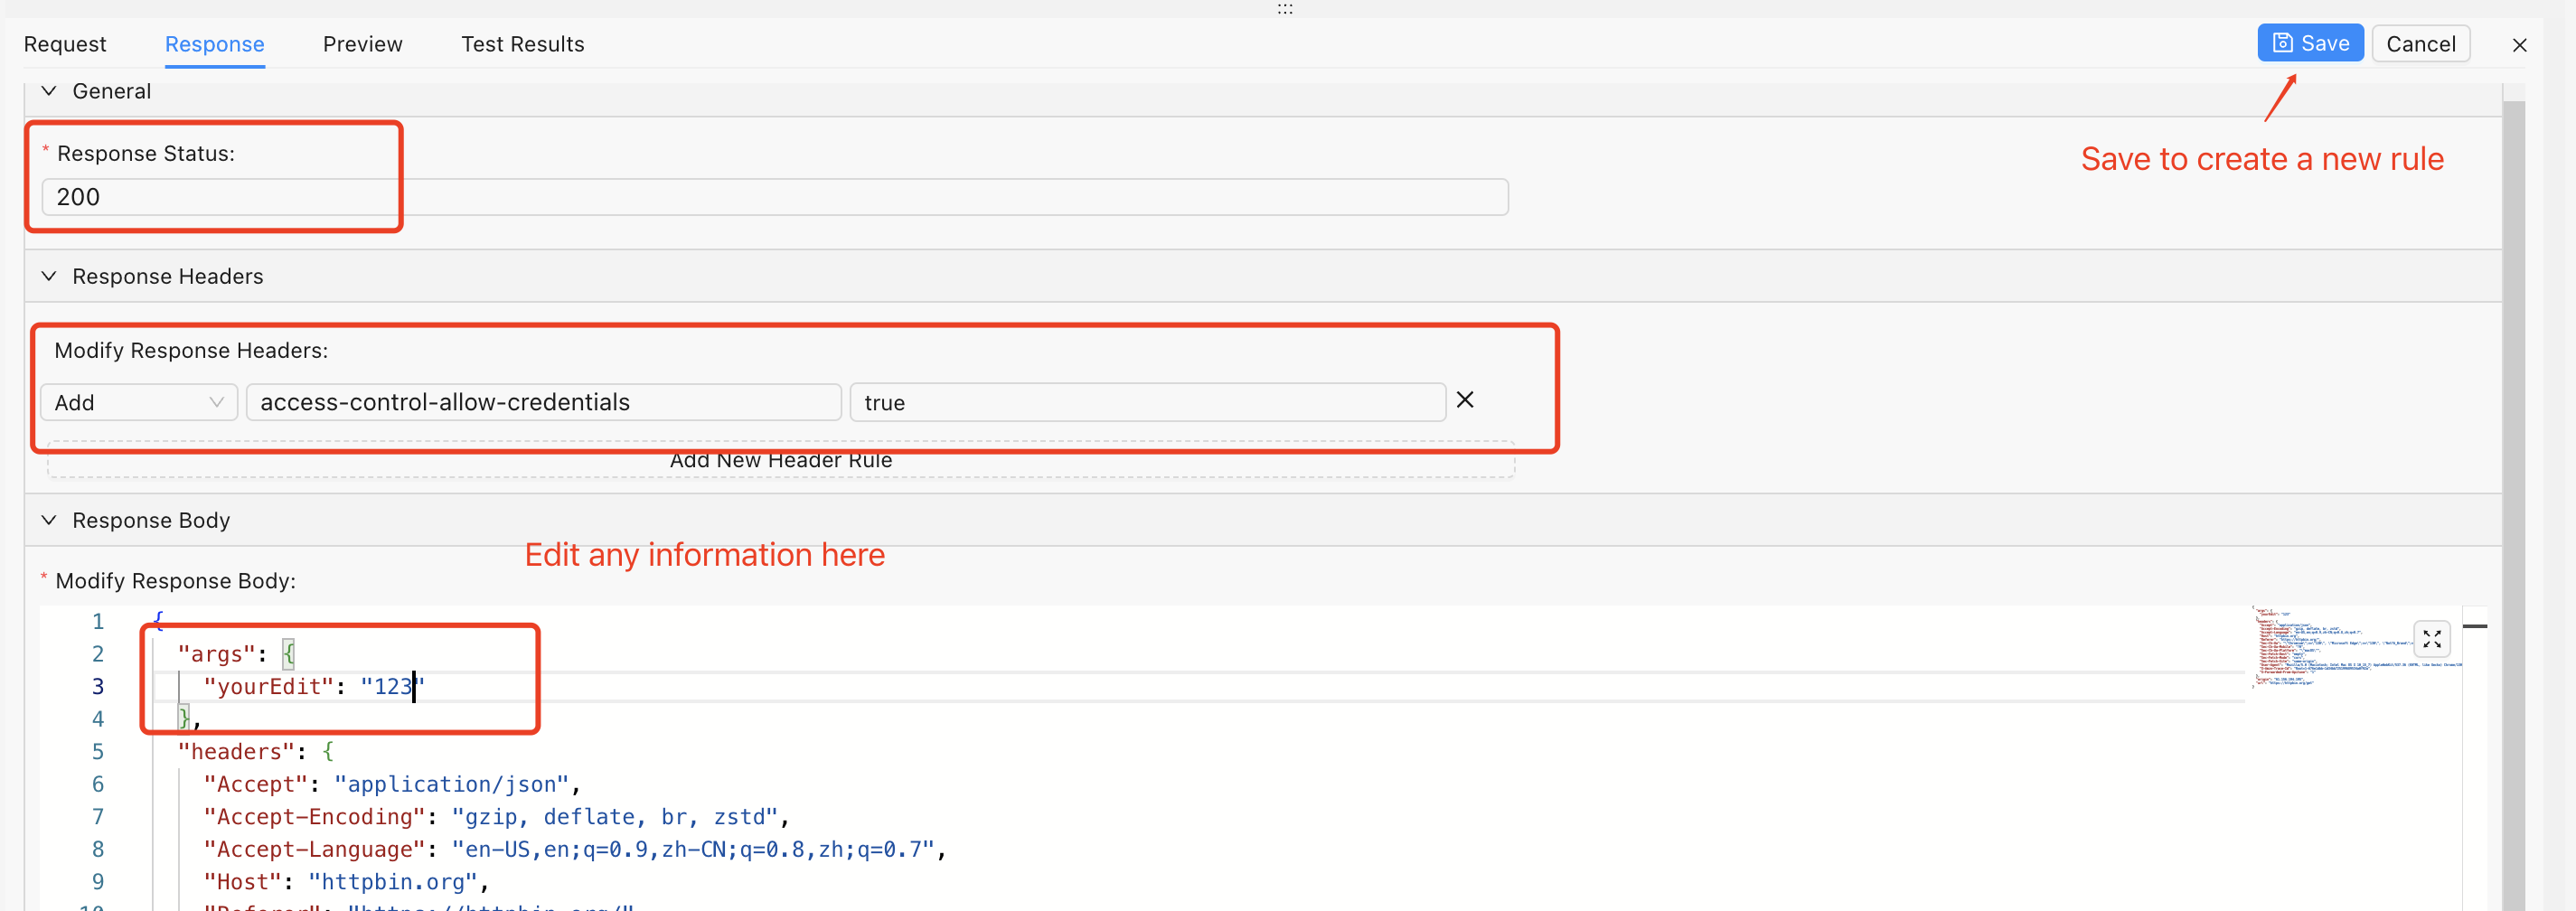
The system creates targeted rules that affect only matching requests/responses.
